You Pay for the Bandwidth That Returns Nothing
A proxy invoice that says 24.79 GB · $198.28 reads like you bought 24.79 GB of data. You didn’t. You bought 24.79 GB of traffic. Some of it came back with rows. Some came back with a block page, a 404, a CAPTCHA challenge, or a retry of a page that already failed. The meter doesn’t care which. It counts the bytes that left the proxy, and it bills all of them at the same rate.
That gap, between bytes you paid for and rows you got back, is where money quietly leaves a healthy run. Not a runaway loop. Not an outage. A run that finished, looked fine in the dashboard, and still spent a third to a half of its bandwidth on responses that returned nothing.
TL;DR
- Per-GB billing charges for failed requests, retries, and asset loads — not just rows. (“You pay for bandwidth consumed, whether requests succeed or fail.” — Titan Network, 13 Apr 2026.)
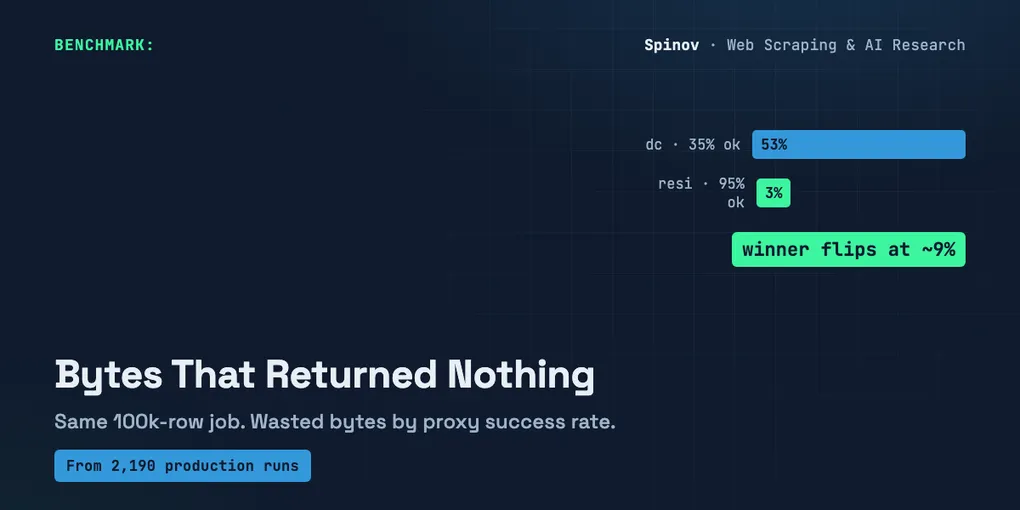
- In a model of a 100k-row job on a protected target, a low-success datacenter config spent 53% of its bytes returning zero rows; a high-success residential config spent 3%.
$/GBis not cost per row. The cheaper-per-GB pool was cheaper per row here — but the winner flips once success drops below ~9%.- I don’t have a dollar billing ledger. The numbers below are a model on published proxy prices. Run it with your own success rate and price.
What the meter actually counts
I run scrapers in production — 2,190 runs across 32 published actors, the Trustpilot one alone at 962 runs. That’s the part I can say with a straight face: I’ve watched a lot of real traffic. What I don’t have is a per-run dollar ledger that itemizes every gigabyte. So I’m not going to paste an invoice I don’t hold and call it data.
Here’s what I can say from watching those logs. The bytes that return nothing aren’t tail noise. They’re a structural line item. Three things feed it:
Failed responses. A request that gets a 403, a challenge page, or an empty card still pulled bytes over the wire. Usually smaller than a real page. A block page isn’t heavy. But it isn’t free either, and at scale there are a lot of them.
Retries. Every failed request you re-attempt spends bandwidth again, and the retry often fails again. This is the multiplier most people forget. Titan Network put a number on it: moving success rate from 60% to 95% cuts your total request count by about 63%, because you stop re-issuing the misses (“Web Scraping Cost at Scale,” Titan Network, 13 Apr 2026).
Asset and redirect tax. A browser-driven load on a “healthy” page pulls more than the HTML — assets, redirects, sometimes a login bounce. Even your successful traffic carries weight that never becomes a row.
None of that shows up as a problem. The run succeeds. The dashboard is green. The bill is just… higher than the rows would suggest.
A model, not a bill
So I wrote the smallest thing that makes the gap visible. It’s stdlib Python, no network, no keys. It takes a job (how many rows you want), a success rate, average response sizes, a retry policy, and a $/GB price — and it tells you what you actually pay per collected row, versus the naive number you’d get if only the row-returning bytes were billed.
The dollar prices are placeholders. I marked them as illustrative in the code and I’ll mark them again here: $8/GB is Titan Network’s stated average for residential; $1.20/GB stands in for a cheap datacenter-style pool. Residential in 2026 runs roughly $2–$15/GB, with $8 landing in the mid-to-premium band (triangulated across Proxyway’s 2026 tests, aimultiple’s pricing comparison, and Titan’s own figures). Swap in yours.
from dataclasses import dataclass

@dataclass
class RunConfig:
    name: str
    target_rows: int       # rows you actually want
    success_rate: float    # fraction of requests that return a usable row
    row_resp_kb: float     # avg KB of a request that returned a row
    fail_resp_kb: float    # avg KB of a request that returned no row
    asset_overhead: float  # extra byte fraction from assets/redirects
    retries_per_fail: float
    price_per_gb: float    # ILLUSTRATIVE — set yours

def model(cfg):
    requests_for_rows = cfg.target_rows / cfg.success_rate
    failed = requests_for_rows - cfg.target_rows
    retries = failed * cfg.retries_per_fail
    KB_PER_GB = 1024 * 1024

    row_bytes = cfg.target_rows * cfg.row_resp_kb * (1 + cfg.asset_overhead)
    fail_bytes = (failed + retries) * cfg.fail_resp_kb

    total_gb = (row_bytes + fail_bytes) / KB_PER_GB
    returned_gb = row_bytes / KB_PER_GB
    total_cost = total_gb * cfg.price_per_gb

    return {
        "total_gb": total_gb,
        "wasted_share": (total_gb - returned_gb) / total_gb,
        "paid_for_per_returned_gb": total_gb / returned_gb,
        "total_cost": total_cost,
        "effective_cost_per_row": total_cost / cfg.target_rows,
    }
Two configs, same job: collect 100,000 rows from a protected target. One cheap datacenter pool that gets blocked a lot. One pricey residential pool that gets through.
cheap_dc = RunConfig("datacenter (cheap/GB)", 100_000, 0.35, 180, 60, 0.40, 1.5, 1.20)
pricey_res = RunConfig("residential (pricey/GB)", 100_000, 0.95, 180, 60, 0.40, 1.5, 8.00)
Running it:
--- datacenter pool (cheap per GB) ---
  success rate           : 35%
  price (illustrative)   : $1.20/GB
  bandwidth billed       : 50.60 GB
  ... returned rows      : 24.03 GB
  ... returned NOTHING   : 26.57 GB  (53% of the bill)
  paid-for per 1GB data  : 2.11x
  total cost             : $60.72
  naive  cost/row        : $0.288 per 1,000 rows
  EFFECTIVE cost/row     : $0.607 per 1,000 rows

--- residential pool (pricey per GB) ---
  success rate           : 95%
  price (illustrative)   : $8.00/GB
  bandwidth billed       : 24.79 GB
  ... returned rows      : 24.03 GB
  ... returned NOTHING   : 0.75 GB  (3% of the bill)
  paid-for per 1GB data  : 1.03x
  total cost             : $198.28
  naive  cost/row        : $1.923 per 1,000 rows
  EFFECTIVE cost/row     : $1.983 per 1,000 rows
Look at the datacenter run. To collect 24 GB of rows it billed 50.6 GB, so it paid for 2.11× the data it kept. More than half the invoice, 53%, returned nothing. The residential run paid for 1.03×: almost everything it bought, it kept.
That’s the whole point in two numbers. Same job, same row sizes. One config converts bandwidth into rows; the other converts about half of it into block pages and retries you still pay for.
So the cheap proxy is the trap, right?
No. And this is where I almost wrote the wrong article.
My first instinct was the clean contrarian line: cheap-per-GB is actually more expensive per row. But the model wouldn’t cooperate. At these numbers the cheap datacenter pool costs $0.607 per 1,000 rows and the pricey residential costs $1.983 — the datacenter is 31% the per-row cost. The 6.7× price gap ($1.20 vs $8.00) is just bigger than its waste penalty. The cheap pool wins here, even bleeding 53% of its bytes.
So the honest claim isn’t “cheap is a trap.” It’s narrower and more useful: $/GB and cost-per-row are different numbers, and which proxy is cheaper depends on how hard the target fights back. The waste fraction is a lever on price, not a verdict.
To find where it flips, I held residential at 95% and dropped the datacenter success rate — the way a target gets harder when it tightens its anti-bot:
flip point — datacenter success rate falling on a harder target:
  dc success   35% : 53% of bytes return nothing, $0.607/1k rows -> cheaper: datacenter
  dc success   20% : 70% of bytes return nothing, $0.975/1k rows -> cheaper: datacenter
  dc success   12% : 81% of bytes return nothing, $1.547/1k rows -> cheaper: datacenter
  dc success    9% : 86% of bytes return nothing, $2.024/1k rows -> cheaper: RESIDENTIAL  <-- flip
  dc success    8% : 87% of bytes return nothing, $2.262/1k rows -> cheaper: RESIDENTIAL
  dc success    5% : 92% of bytes return nothing, $3.550/1k rows -> cheaper: RESIDENTIAL
There’s the flip, around 9% success. Below it, the cheap pool is wasting so much bandwidth (86% of bytes returning nothing) that even at one-sixth the price it loses on a per-row basis. Above it, cheap wins.
So “the expensive proxy is cheaper” is a regime, not a law. It’s true on the targets that beat your cheap pool into the single digits. It’s false on the targets your cheap pool handles fine. The only way to know which target you’re on is to measure your own success rate and put it in the model — not to pick a proxy by its sticker price per GB.
What I’d change on Monday
Stop pricing proxies by $/GB in isolation. That number is the cost of the traffic, and you don’t want traffic. You want rows.
Three things that move the per-row number more than the sticker price:
- Log success rate per target, not globally. A 90% average can hide a target sitting at 12%, and that target is eating your bill. The flip lives in the per-target number.
- Cap retries per failed request, and watch the multiplier. At 60% success you’re issuing ~1.7 requests per row before retries; the retries pile on top. Re-issuing a request that fails the same way twice is just buying the same block page again.
- Run the model before you switch pools. A “cheaper” pool that drops your success rate can cost more per row. A “pricey” pool that lifts it can cost less. You can’t tell from the price tag.
I’ll repeat the limit because it matters: this is a model on published prices, not a measured invoice. I don’t have a per-run dollar ledger to show you. What I do have is the shape of the traffic from a lot of production runs — the part that returns nothing is real and it’s structural — and a 60-line script that turns your own success rate into a per-row cost. The dollars are yours to fill in.
The honest open question for me: I’ve been treating fail_resp_kb (the size of a block/challenge response) as a flat 60 KB. On JS-challenge targets a “failed” attempt can pull a full interactive challenge page — heavier than the real data page. If your failures are bigger than your successes, the waste fraction climbs faster than this model shows. I haven’t pinned that distribution down per target yet. If you’ve measured the byte size of your failures versus your successes, I’d genuinely like to see the numbers.
Written by Aleksey Spinov. I write up the cost and failure math from real production scraping — 2,190 runs and counting. Follow for the next one, and if you’ve metered the bytes a failed request actually costs you, drop the number in the comments — I read every one.
AI disclosure: drafted with AI assistance; all numbers, the model, and its output were produced and verified by me. The Python in this post was run locally (stdlib, no network); the output shown is the real run, not a mock-up.