10 Keyless Statistics APIs: Never Delete the World Row
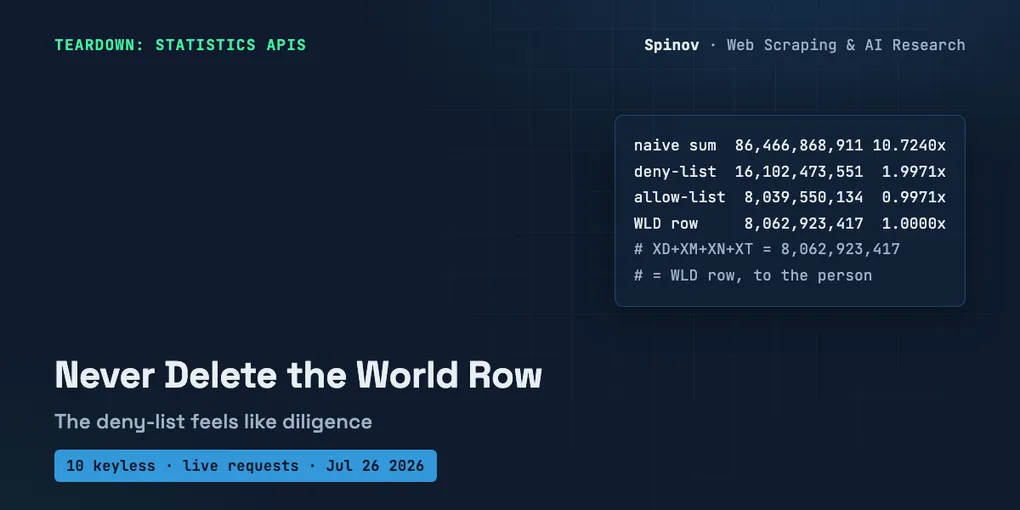
One indicator, one year, one keyless endpoint. I asked the World Bank for population in 2023, got 264 rows with a value, and added them up four different ways:
naive sum of every row         86,466,868,911  10.7240x
deny-list on countryiso3code   16,102,473,551   1.9971x
allow-list on country.id        8,039,550,134   0.9971x
the WLD row itself              8,062,923,417   1.0000x
Line one is a joke and nobody ships it. Line two is the one that ends up in a report, because 8 billion people looks like 8 billion people until you notice there are two of them.
The one idea
A keyless statistics API returns indicators by country and year with no API key, no signup and no card. I checked ten of them with live requests on July 26, 2026, and the table is two screens down. The catch they mostly share: totals and members arrive in one list, in one schema, and on eight of the ten the data rows carry no column that says which is which. “World” is a row. So is “High income”. So is Belgium. Two of the ten do carry that column, and I owe them the credit: WHO GHO and UN Comtrade. There is a section on them below, because the exception is the useful part.
Your instinct will be to filter the totals out. Mine was. That instinct is what produced the second line above, and the second line is worse than the first.
Better move: keep the total row and make it a test. The row that ruins your sum is the only free check on your own filter that you will ever be handed.
First, the probes that had to fail
If a checking script only ever reports success, it is not a check, it is a decoration. So before the first 200 I made the channel fail in as many ways as I could, on July 26, 2026:
| # | Probe | Result |
|---|---|---|
| N1 | host that does not exist, api-zzqq9182-nosuchhost-77.org | curl exit 35, HTTP 000 |
| N2 | real host, junk path, api.worldbank.org/v2/ZZQQNOSUCHPATH9182 | HTTP 404 |
| N3 | real host, junk indicator ZZ.QQ.NOSUCH | HTTP 200 plus {"id":"120","key":"Invalid value"} |
| N4 | FRED without a key | HTTP 400, Variable api_key is not set |
| N5 | US Census api.census.gov/data/2023/pep/population?get=NAME,POP_2023&for=state:* without a key | 302 then HTTP 200 on missing_key.html (the bare path with no query returns a plain 404) |
| N6 | BEA without a key | HTTP 200, content-length: 0 |
| N7 | WHO GHO with $top=2000 | HTTP 400; at $top=500 it returns 200 |
Seven probes, five shapes of failure: a dead socket, a 404, a 200 carrying an error object, a 400 with an English sentence, and a 200 carrying nothing at all. So “keyless” here means “I called it with no credentials and got data”, never “the docs said free”.
That is also why three services people list as free statistics APIs are missing from my ten. FRED, BEA and the US Census all want a key, and they say so in three different ways. Only one of them uses an error status to do it.
The 10 keyless endpoints, checked live
Every row below is a request I made on July 26, 2026 with no key, no account and no card. The “level signal” column is the whole point of the article: it says what, if anything, in the response tells you whether a row is a member or a total.
| # | Provider | Keyless endpoint | Rows I got | Level signal |
|---|---|---|---|---|
| 1 | World Bank Indicators | api.worldbank.org/v2/country/all/indicator/SP.POP.TOTL?date=2023 | 265 entities, 264 with a value | none in the data row; a separate /v2/country call carries region.value == "Aggregates" |
| 2 | Eurostat | ec.europa.eu/eurostat/api/dissemination/statistics/1.0/data/nama_10_gdp | 46 geo entries for 2023 | none; aggregates are recognizable only by code (EU27_2020, EA, EA19, EA20, EA21, EA12) |
| 3 | IMF DataMapper | imf.org/external/datamapper/api/v1/NGDPD | 229 codes in one flat object, 227 with 2023 | none inline; separate /countries (241), /groups (129) and /regions (27) endpoints exist |
| 4 | Our World in Data | ourworldindata.org/grapher/population.csv | 257 entities for 2023 | naming convention only: OWID_ and UN_ prefixes, with exceptions in both directions |
| 5 | DBnomics | api.db.nomics.world/v22/series/WB/WDI | dimension named country with 266 codes | none; WLD = World and HIC = High income sit inside a dimension called country |
| 6 | WHO GHO | ghoapi.azureedge.net/api/WHOSIS_000001?$top=500 | 500 rows | explicit: SpatialDimType on every row, plus ParentLocation |
| 7 | ILOSTAT | rplumber.ilo.org/data/indicator/?id=UNE_2EAP_SEX_AGE_RT_A | 91,692 rows, 276 distinct areas | only with type=code: aggregates are X01, X06, X21; type=label erases it |
| 8 | UN Comtrade (preview) | comtradeapi.un.org/public/v1/preview/C/A/HS | 224 rows for US exports, 2023 | partnerCode == 0 means world; isAggregate is true on all 224 at cmdCode=TOTAL, and true on exactly the world row at a leaf code |
| 9 | UNESCO UIS | api.uis.unesco.org/api/public/definitions/geounits | 462 units: 241 NATIONAL, 221 REGIONAL | explicit, but in the catalogue call, not in the data rows |
| 10 | UK ONS (beta) | api.beta.ons.gov.uk/v1/datasets/regional-gdp-by-year/... | 12 geographies, 23 industry codes | none; England (UK0) sits in the same list as its own nine regions |
Ten sources, no keys. Two of them (WHO GHO, UNESCO UIS) will tell you the level outright. One (IMF) will tell you in a second call. One (ILOSTAT) will tell you only if you ask for codes instead of labels. The other six leave it to you.
The World Bank arithmetic, in full
Here is the whole thing, runnable, standard library only, one network call each to two endpoints:
# runnable, standard library only, needs network
import json, urllib.request

UA = {"User-Agent": "aggregate-check/1.0"}

def fetch(url):
    req = urllib.request.Request(url, headers=UA)
    with urllib.request.urlopen(req, timeout=60) as r:
        if r.status != 200:                      # fail loud, never a silent default
            raise RuntimeError(f"HTTP {r.status} for {url}")
        return json.loads(r.read().decode())

IND = ("https://api.worldbank.org/v2/country/all/indicator/"
       "SP.POP.TOTL?format=json&date=2023&per_page=400")
REF = "https://api.worldbank.org/v2/country?format=json&per_page=400"

rows = [r for r in fetch(IND)[1] if r["value"] is not None]
ref  = fetch(REF)[1]

AGG_ISO3 = {c["id"]       for c in ref if c["region"]["value"] == "Aggregates"}
AGG_ISO2 = {c["iso2Code"] for c in ref if c["region"]["value"] == "Aggregates"}
CTY_ISO2 = {c["iso2Code"] for c in ref if c["region"]["value"] != "Aggregates"}
CTY_ISO3 = {c["id"]       for c in ref if c["region"]["value"] != "Aggregates"}

world = next(r["value"] for r in rows if r["country"]["id"] == "1W")

naive  = sum(r["value"] for r in rows)
deny   = sum(r["value"] for r in rows if r["countryiso3code"] not in AGG_ISO3)
allow3 = sum(r["value"] for r in rows if r["countryiso3code"] in CTY_ISO3)
allow  = sum(r["value"] for r in rows if r["country"]["id"] in CTY_ISO2)

for label, total in [("naive sum of every row", naive),
                     ("deny-list on countryiso3code", deny),
                     ("allow-list on countryiso3code", allow3),
                     ("allow-list on country.id", allow),
                     ("the WLD row itself", world)]:
    print(f"{label:<30}{total:>15,}{total/world:9.4f}x")

leak = [r for r in rows if r["countryiso3code"] not in AGG_ISO3
        and r["country"]["id"] in AGG_ISO2]
print(f"\naggregates that survived the deny-list: {len(leak)}")
for r in sorted(leak, key=lambda x: -x["value"]):
    print(f"  id={r['country']['id']}  iso3={r['countryiso3code']!r:<4}"
          f"{r['country']['value']:<22}{r['value']:>14,}")
print(f"  their sum {sum(r['value'] for r in leak):>15,}")
print(f"  WLD row   {world:>15,}")
Output on my machine, July 26, 2026, pasted as it came out:
naive sum of every row         86,466,868,911  10.7240x
deny-list on countryiso3code   16,102,473,551   1.9971x
allow-list on countryiso3code   8,039,550,134   0.9971x
allow-list on country.id        8,039,550,134   0.9971x
the WLD row itself              8,062,923,417   1.0000x

aggregates that survived the deny-list: 4
  id=XT  iso3=''  Upper middle income    3,057,927,413
  id=XN  iso3=''  Lower middle income    2,869,695,351
  id=XD  iso3=''  High income            1,408,138,595
  id=XM  iso3=''  Low income               727,162,058
  their sum   8,062,923,417
  WLD row     8,062,923,417
Read the last two lines twice. The four income groups sum to 8,062,923,417, and the World row is 8,062,923,417. Not close. Equal, to the person. They are a complete partition of the planet, so they contribute exactly one extra Earth, and they do it while wearing an empty countryiso3code.
The catalogue knows about them. /v2/country returns 295 records, 78 marked region.value == "Aggregates", and the four income groups sit there with three-letter ids: HIC, LIC, LMC, UMC. The World Bank has a perfectly good alpha-3 code for High income. The indicator payload just sends an empty string instead. Same entity, an identity in the catalogue and none in the data.
Why 1.9971x is worse than 10.72x
Ten times the world population is not a bug you ship. Somebody glances at the chart, sees 86 billion, and the whole thing gets thrown back at you before lunch.
Twice the world population is different. Nobody knows the planet’s headcount to the digit. 16.1 billion in a cell labelled “total population covered” reads as a big number in a big dataset, and it passes the two-second sniff test that a human actually performs, which is “is this the right order of magnitude”. You do not get caught. You get cited.
And the deny-list feels like diligence. You looked up the aggregate codes, you excluded them, the number dropped by a factor of five and stopped looking absurd. Every signal you have says the repair worked.
UN Comtrade makes the same point without the rounding. I asked for US exports in 2023, all partners, commodity total:
rows returned                    224
partnerCode == 0 (the world)     2,018,542,583,771
sum of the other 223 partners    2,018,542,583,771
sum of all 224 rows              4,037,085,167,542   2.0000x
Two trillion dollars of exports, counted twice, on a response where the sum of the parts equals the declared total to the dollar. If you had not looked, the only tell would have been that your figure was too round.
The field you would reach for, and three ways it goes wrong
There is usually something in the payload that looks like the answer. Three of the ten taught me three different lessons about it: one where the field is present and empty, one where the naming convention leaks in both directions, and one where the field was right the whole time and my own query blinded it.
World Bank: the field is present and empty. countryiso3code is a fine key for 260 of the 264 rows. On four it is "". A deny-list (“skip rows whose code is a known aggregate”) lets the empty string through. An allow-list (“keep rows whose code is a known country”) does not, because "" is not a country either.
Same field, same reference table, opposite outcomes: lines two and three of the output above, 1.9971x against 0.9971x. The only difference is which direction you wrote the test in. If you would rather key on something never blank, country.id is a two-character code present on all 265 rows: alpha-2 for economies, World Bank codes like 1W, XD and S1 for aggregates.
UN Comtrade: the field works, and my query broke it. There is a boolean called isAggregate, and on my request it was true on all 224 rows: on the world row, on Canada, on Mexico, on China. I first wrote that up as a useless field. That was wrong, and checking it is what showed me why. Ask the same endpoint for a leaf commodity instead of the total (cmdCode=270900, crude petroleum) and the same field returns 42 rows with isAggregate true on exactly one of them, the partnerCode=0 world row, and false on the other 41. The field marks aggregation along whichever axis you asked to aggregate. cmdCode=TOTAL is itself an aggregate over every commodity, so every row I got back was an aggregate, and the field said so correctly. The lesson is not “the flag lies.” It is that a flag answers the question your query asked, not the question in your head.
Our World in Data: the convention leaks in both directions. OWID prefixes aggregates with OWID_. Filter on that and you catch 13 rows, then land on 17,222,487,438, which is 2.1284x the World row. Drop the one row that carries no code at all (Americas (UN), 1,041,794,257) and you get 16,180,693,181, 1.9997x. Two operations, not one, and only the second gets you to the number that looks defensible. Six more aggregates use a UN_ prefix instead: UN_ASI, UN_AFR, UN_EUR, UN_LAC, UN_NAM, UN_OCE. Those six sum to 8,091,734,921 against a World row of 8,091,734,933. Twelve people apart.
The leak runs the other way too. OWID_KOS is Kosovo, a country wearing the aggregate prefix because it has no alpha-3 code, and one row (Americas (UN)) has no code at all. Drop everything prefixed and you delete a country; keep everything ISO3-shaped and you keep six continents.
Eurostat adds a fourth flavour, less a lie than a crowd. The nama_10_gdp geo dimension for 2023 has 46 entries, six of them aggregates, five of those overlapping euro-area vintages. Two are byte-identical: EA and EA20 both report 14,666,808.1 million euro. Sum all 46 and you get 6.3817x the EU27 total. DBnomics, meanwhile, puts WLD and HIC inside a dimension whose name is literally country. 266 codes, one namespace.
Who does label the level
The honest version of this post is not “nobody marks the totals”. Somebody does, and the difference is one field. Two of the ten carry it in the data rows: UN Comtrade, from the section above, once you stop asking it a question whose answer is always yes, and this one.
WHO GHO puts it on every row. Life expectancy at birth, WHOSIS_000001, first 500 rows:
SpatialDimType: COUNTRY 478 | REGION 11 | WORLDBANKINCOMEGROUP 8 | GLOBAL 3One column, four values, no catalogue call, no naming convention, no join. Every row states its own level. There is a ParentLocation field too, so a row also tells you what it rolls up into. That is the whole fix, shipped upstream, by an organisation with at least as much committee overhead as the others.
UNESCO UIS states it in the catalogue. /definitions/geounits returns 462 entries, each with a type: 241 NATIONAL and 221 REGIONAL. Clear, but it is a separate call, and the data rows come back as {"indicatorId", "geoUnit", "year", "value"} with no level in sight.
The IMF ships three lists. /countries (241), /groups (129) and /regions (27) are all keyless. The indicator payload itself is one flat object where WEOWORLD, ADVEC, EU and USA are peers; sum all 227 codes with a 2023 value for NGDPD and you get 671,589.964 billion USD against a WEOWORLD of 107,245.572, which is 6.2622x.
ILOSTAT encodes it, then offers to throw it away. With type=code you get 276 areas: 87 start with X (X01 World, X06 Africa, X21 Americas, X84 ASEAN) and 189 are ISO3-shaped. A real signal, since ISO 3166 leaves the X block user-assigned.
Ask the same endpoint for type=label, the friendlier parameter you reach for when you want a chart, and the codes vanish. “World” and “Afghanistan” come back as two strings of the same type. You destroyed the signal yourself, with a query parameter, and the response looks nicer for it.
Where the alarm stops working
Population is additive, so a mistake shows up as a number that is 2x or 10x too big. Plenty of indicators are not additive, and there the same mistake produces nothing to see.
The UK ONS beta API, regional GDP by year, chained volume measure, annual index, all industries, 2021. Twelve rows, one flat list:
UKF  East Midlands                98.6
UKH  East of England              96.2
UKI  London                       96.4
UKJ  South East                   96.6
UKK  South West                   96.2
UKD  North West                   97.1
UKE  Yorkshire and The Humber     97.4
UK0  England                      96.6
UKL  Wales                        97
UKC  North East                   95.2
UKG  West Midlands                96.1
UKZ  Extra-regio                  81.2
UK0 is England. Nine of the other eleven rows are inside it. Every code is three characters starting with UK, so nothing about the shape separates the parent from its children, and the response has no level field.
Now take the average across those twelve, which is what a dashboard does. You get 95.3833. Drop England and average the remaining eleven: 95.2727. A tenth of an index point apart. There is no 10x, no 2x, no absurd figure to catch you. The number is simply a little wrong, forever, and no assertion you can write on magnitude alone will ever fire.
The same dataset does it twice, by the way. The industry dimension has 23 codes including A--T (“A-T: Total”), B--E (“Production Industries”) and G--T (“Services sector”) sitting beside the single letters they contain. The only tell is the double dash.
The fix: keep the total, and make it a test
The reflex is to delete the aggregate rows and move on. Do the opposite. The total row is the only place in the response where the provider tells you what the answer should be, and throwing it away is throwing away your test data.
Two rules. Allow-list, never deny-list, because an allow-list fails closed on an empty or unknown key. Then assert your members against the declared total.
# runnable, standard library only, continues the script above
def split_levels(rows, ref):
    """Allow-list the members, name the totals, refuse anything unclassified."""
    members = {c["iso2Code"] for c in ref if c["region"]["value"] != "Aggregates"}
    totals  = {c["iso2Code"] for c in ref if c["region"]["value"] == "Aggregates"}
    kept, dropped, unknown = [], [], []
    for r in rows:
        key = r["country"]["id"]        # populated on every row; iso3 is not
        (kept if key in members else dropped if key in totals else unknown).append(r)
    if unknown:
        raise ValueError(f"{len(unknown)} rows in neither list: "
                         f"{[u['country']['id'] for u in unknown][:5]}")
    return kept, dropped

def check_against_total(members, declared, tolerance=0.01):
    got = sum(r["value"] for r in members)
    drift = (got - declared) / declared
    if abs(drift) > tolerance:
        raise AssertionError(f"members sum to {got:,}, total row says {declared:,} "
                             f"({drift:+.2%}) - the filter is wrong, not the data")
    return got, drift

members, totals = split_levels(rows, ref)
got, drift = check_against_total(members, world)
print(f"members kept   {len(members)}")
print(f"totals dropped {len(totals)}")
print(f"members sum    {got:,}")
print(f"WLD row says   {world:,}")
print(f"residual       {got - world:,}  ({drift:+.2%})")

# a check that cannot fail is decoration: feed it the deny-list version
sloppy = [r for r in rows if r["countryiso3code"] not in AGG_ISO3]
try:
    check_against_total(sloppy, world)
except AssertionError as e:
    print(f"\ndeny-list version -> {e}")
Output, same run:
members kept   217
totals dropped 47
members sum    8,039,550,134
WLD row says   8,062,923,417
residual       -23,373,283  (-0.29%)

deny-list version -> members sum to 16,102,473,551, total row says 8,062,923,417 (+99.71%) - the filter is wrong, not the data
That message is the payoff. A +99.71% drift is not a judgement call, and it fires the moment your classification is wrong, in CI, before anyone charts it. An unclassified row raises a ValueError instead, because split_levels refuses to guess. Non-additive indicators need a different comparison than a sum, but the shape holds: the provider published the answer, so check against it.
The residual I could not explain
-23,373,283 people, or -0.29%. I set the tolerance to 1% because I measured the gap first and then picked a threshold that passes it, which you should know before you copy the number.
I do not know where it comes from. All 217 countries in the reference list are present in the 2023 response, so it is not a missing row. It might be territories the World Bank counts in the world total but not among its economies, or a vintage difference between the aggregate and its members.
One thing I noticed and then refused to write down as a finding: Our World in Data puts Taiwan’s 2023 population at 23,317,145, and the World Bank does not list Taiwan among its economies at all. Within 0.24% of my residual. That is the kind of coincidence that feels like an explanation, and nothing I called gives me evidence it is one. Two close numbers are not a mechanism. If you know the real answer, I want it.
What I nearly published and had to take back
While checking DBnomics I ran country_labels.get("XD") and got nothing back. Same for XM, XN, XT. I had a lovely paragraph half-written: the mirror ingested the World Bank feed, keyed on the code that was empty, and dropped exactly the four aggregates that break everyone else.
It was wrong. I searched by label instead of by code and found HIC High income, LIC Low income, LMC Lower middle income, UMC Upper middle income, all present. DBnomics keys on the alpha-3 ids the World Bank publishes in its own catalogue, which is exactly the code the indicator payload declines to send. Nothing was dropped. My probe had returned an empty result that read like evidence, and the mirror turned out to be more faithful to the World Bank’s catalogue than the World Bank’s own data rows.
That is the failure mode I keep meeting in this work, and it is not specific to statistics APIs: a lookup that returns nothing looks identical whether the thing is absent or your query was wrong. The only defence is to make the check prove it can find something before you trust it finding nothing.
This is not the response-envelope post
Two neighbours, so let me draw the lines by hand.
I covered the World Bank once before, in a roundup of keyless government APIs, where the trap was structural: the response is a two-element array, [0] is pagination, [1] is your data. That one is about unpacking. This post assumes you unpacked correctly and starts a step later, when the rows are in hand and you cannot tell what kind of thing each one is.
Nor is it the scale problem from keyless currency APIs, where everyone agreed on the entity and disagreed on how many digits it had. Here the scale is fine. What is contested is whether the row in front of you is a member or a summary of members. And the damage is extra rows, not missing ones, so it inflates rather than erases.
Honest limits
- This is a snapshot. All ten were keyless on July 26, 2026, from one machine, one IP. I did not read anyone’s terms or measure their limits, which is why there is not a single rate-limit number in this post.
- One indicator per provider, mostly population or GDP. The ratios belong to that indicator and year, not to the provider.
SP.POP.TOTLfor 2023 produced 10.7240x; another indicator with different aggregate coverage lands somewhere else. - Additive only. The sum-versus-total check works because headcounts add. Rates and indices do not, and the ONS example is the alarm going quiet exactly there. I did not build the weighted-mean version.
- The four income groups matching the World row to the person is a property of that partition, not a law. The regional aggregates in the same response overlap and partition nothing cleanly, which is why the naive sum is a ragged 10.72x.
- I did not classify all 276 ILOSTAT areas by hand. I counted X-prefixed codes and trusted the convention. If ILOSTAT ever gives a country an X code, my count is wrong.
- Provenance. I run scrapers and data pipelines in production, 32 published actors and something over 2,000 runs, and enrichment feeds are where I picked up the habit behind this post: they lie with a confident 200 far more often than they fail honestly. The ten checks here are one sitting, not a production sample, and I am not going to dress them up as one.
- An aside, since I noticed it. The ONS observation payload returns dimension hrefs pointing at
10.30.156.187:10500, a private address unreachable from the internet. Harmless here, but do not build a crawler that follows them.
The open question
The check I described works when the provider publishes the total. Eight of these ten publish a total I could actually see in the data I pulled. UNESCO I could not confirm from data rows: the aggregate geoUnit request came back HTTP 200 with an empty records array, which tells me nothing either way. And the ONS series I pulled has no total row at all: twelve rows, nine English regions plus England, Wales and Extra-regio, with no UK, no Scotland and no Northern Ireland. So “never delete the world row” is decent advice right up until there is no world row, and then you are back to trusting a sum nobody published.
The overlapping case is where I run out of answers. In one World Bank response, XD/XM/XN/XT partition the planet exactly and the regional aggregates do not, because economies belong to several groupings at once. So “sum the members and compare” only works once you know which aggregate set is a partition, and the payload does not tell you that either. I hard-code the partition I trust per provider and treat the rest as decoration. It does not scale past the handful of feeds I actually use.
If you pull cross-country statistics regularly: how do you decide which aggregate set is the partition, and do you keep that knowledge in code, in a config file, or in your head? 👇
Written with AI assistance. Every status code, row count, sum and command output above comes from my own live requests and negative controls on July 26, 2026, printed as they came out.